Tuesday, April 29, 2014

Dendrochronology


The picture above was supplied in class from a recently cut down tree. By simply counting the tree rings that appeared as the tree went through its growing cycles, the approximate age of the tree can be determined. Although not precise, I counted 67 rings in this tree which means it has seen some history while in Macon. Although not Georgia related, this means that the tree has been around while the Florida Gators football team has won 9 conference titles, 3 National championships, and appeared in 40 bowl games. The basketball team has also won 9 conference regular season titles, 4 conference tournament titles, appear in 4 final fours, and win 2 National championships.
Monday, April 28, 2014

Trees and Shrubs

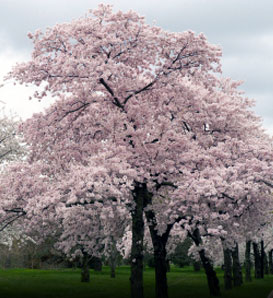
Cherry, Japanese Flowering Yoshino:

Prunus x yedoensis

This tree has been made famous in the Macon area and is celebrated with the Cherry Blossom Festival 
Japanese Flowering Cherry—Prunus x yedoensis 

Live Oak Tree:

Quercus virginiana
This tree is one of the most prominent growers in the southeast United States and is characterized by its rapid growth and huge size at maturity.

 Live Oak - Quercus virginiana

Loblolly Pine Tree:

Pinus Taeda L.

This pine tree is a common Georgia native and is considered to be one of the most used trees in the paper industry which can be found in Macon.


Crepe Myrtle

lagerstoemia

Mostly used as a decorative plant, this shrub can be found throughout the southeast and especially in the Macon area


Mitochondrial Eve


Mitochondrial Eve is a general population that all humans come from and is located in northeast Africa. The concept that one hundred percent of mitochondrial DNA comes from the maternal line allows scientist to trace human lineage all the way back to this single Mitochondrial Eve.


The diversity of the human race in modern times can sometimes create the sense that humans are all different. Mitochondrial Eve, however, can prove that the distinctions we see today are just transformations that took place due to the environment that people moved to.

The following pictures show just how much the different regions have allowed humans to transform over the thousands of years.
African Descent:
 
Indian Descent:
European Descent:
Asian Descent:
Native American Descent:

Maps

Dot Density: These maps place single dots as data points on a regional map. As the dots continue to be added, the locations that contain more points clearly become denser and darker,

Chloropleth: This type of map sets each region to a certain color in order to distinguish certain data locations. In the example below, the darker the county, the more Hispanics that live in that county.

Isarithmic: This map is similar to the chloropleth map except the colored regions are not bounded by predetermined regions but rather based on statistical data alone.

Proportional Symbol: These maps place the same symbol in each region but use the size of that symbol as the indicator of the data.

Tuesday, March 18, 2014

Geology Report

3 different types of rock are found on the planet in the form of igneous, metamorphic and sedimentary. Igneous rocks are formed due to volcanoes while Metamorphic rocks are formed due to the increased temperature and pressure that is found in the crust of the earth. Sedimentary rocks are formed when different layers of soil are compressed on top of each other.

Metamorphic rocks:
Slate

This rock is formed through the metamorphism of shale.

Igneous rocks:
Pumice

This rock is formed through rapid solidification of melt.

Sedimentary rocks:
Limestone

This rock is formed from the accumulation of shell coral and algal.

A great way to classify soil is through the use of the soil triangle as talked about in class. Simply follow each percentage on the three sides to classify any type of soil found.  Every type of soil can be classified in the 12 soil orders of the earth as described in the following link:

http://www.nrcs.usda.gov/wps/portal/nrcs/detail/soils/edu/?cid=nrcs142p2_053588

Below is also a diagram of the soil triangle.


Monday, March 17, 2014

Simple Homemade Barometer

A barometer is used to measure the pressure in the surrounding atmosphere. Such devices can be quite precise, complicated, and intricate. A barometer can also b made from simple household items and while it may not be the most precise instrument in the field, it can still provide insight into the changes in pressure at certain locations.

Making the barometer requires little more than putting a flexible membrane such as a balloon on the top of a fixed volume of air and taping a straw to the top which allows measurements to be taken as the below moves up and down according to the pressure.

Using data obtained from the pressure in the atmosphere and the subsequent height at the end of the straw, a graph can be plotted to show what resulting straw locations are produced from different pressures. The table of data and resulting plot are shown below.

Thursday, February 27, 2014

Sunflower Track


This blog will track the life of a sunflower planted in ENB 150

After two weeks and no germination, we have decided that the first attempt of growing a sunflower has failed. A new seed will be planted with updates on progress coming later.

3/4/14
First signs of a sprout coming through the soil!

3/7/14
Just a few days later and we have some good looking growth.